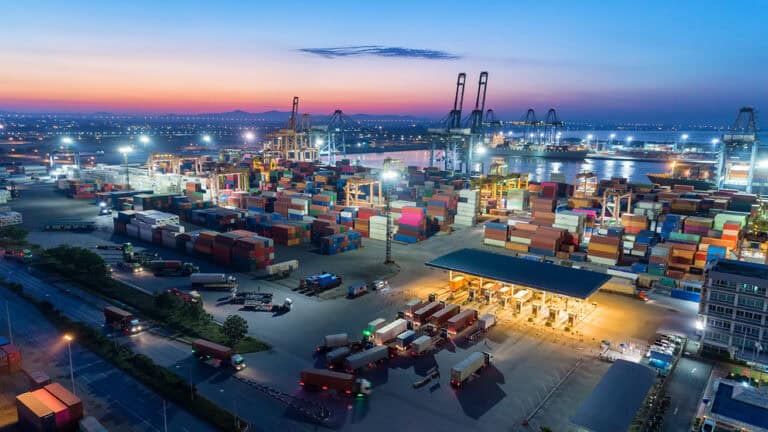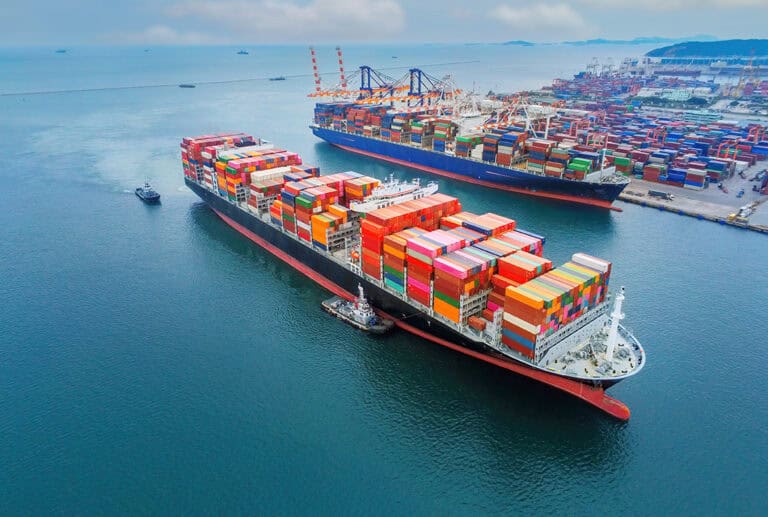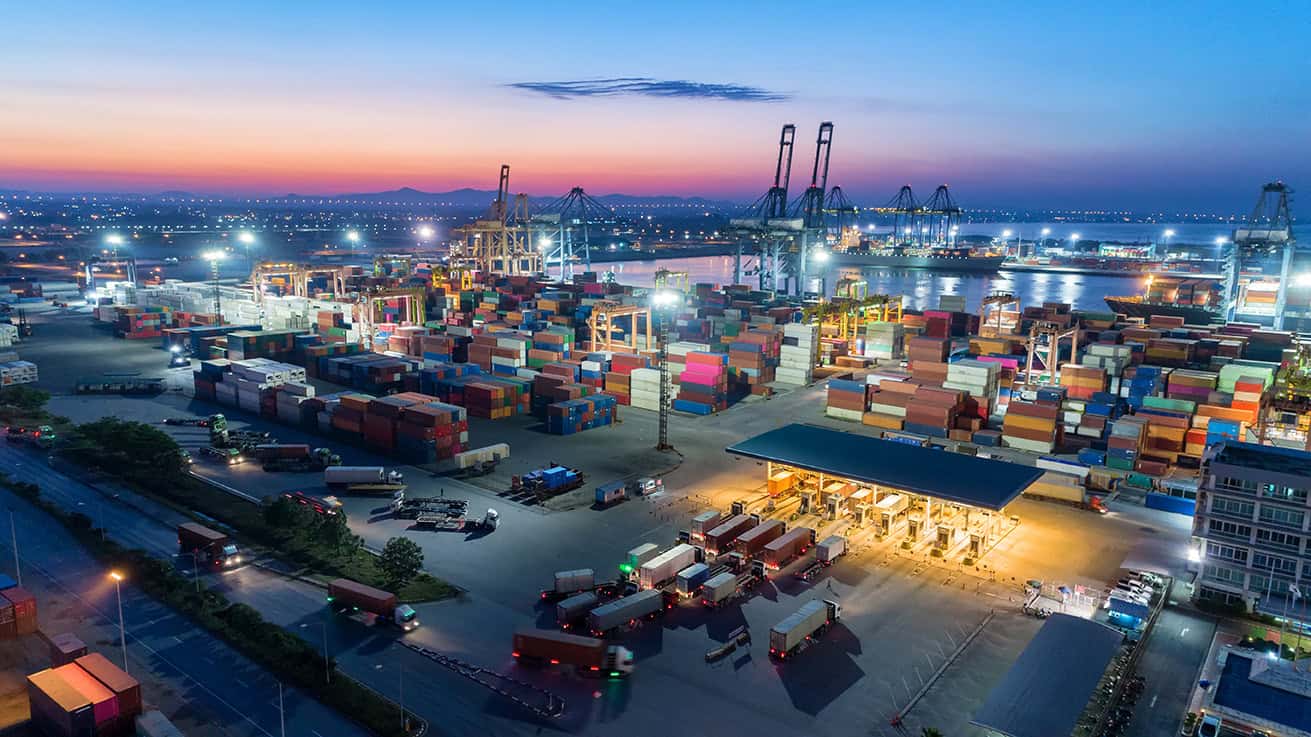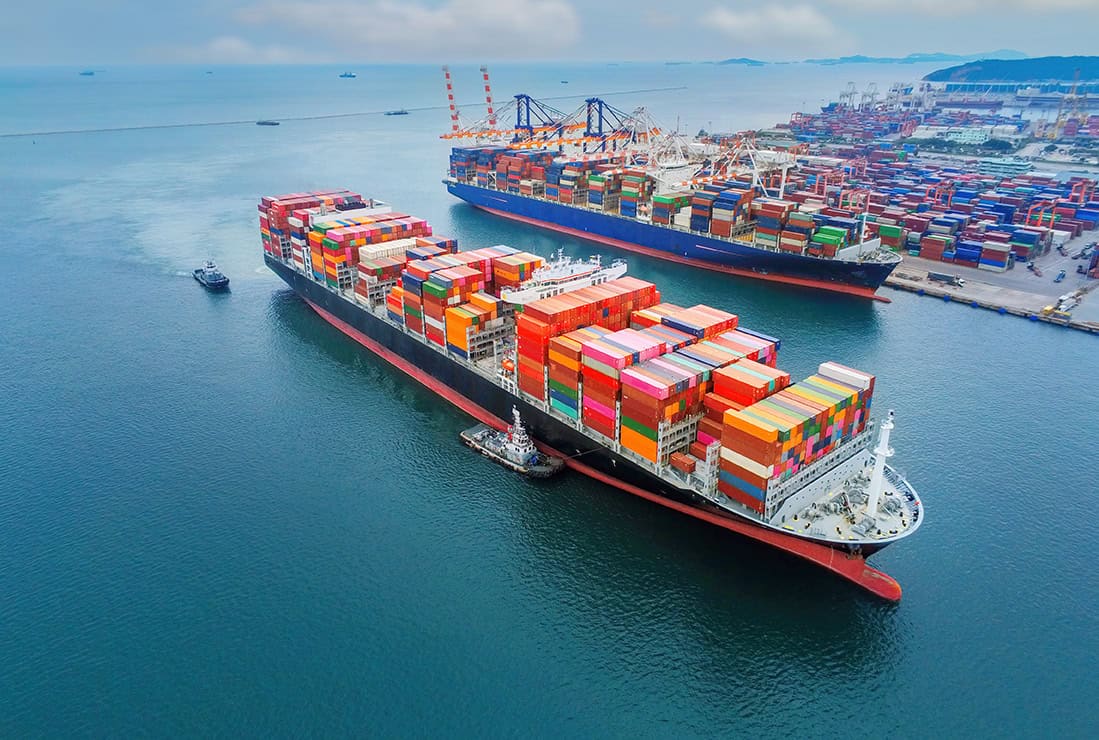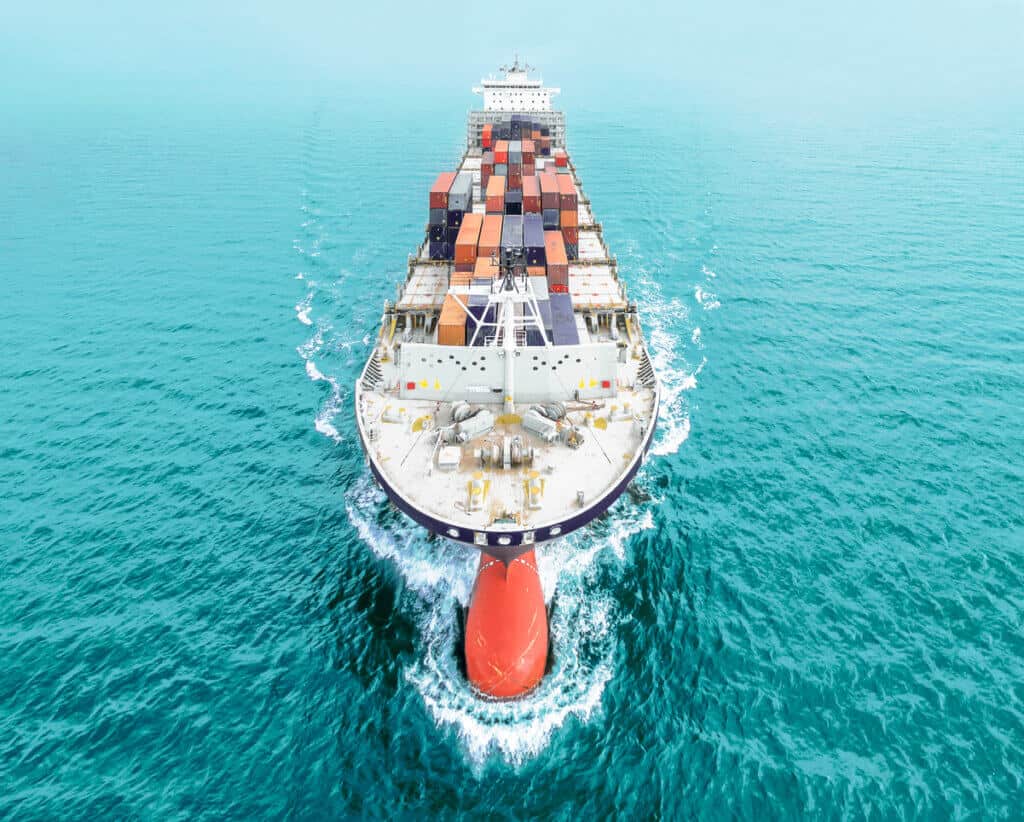
A few weeks ago, when the US port crisis boiled up enough to garner the attention of every major media outlet in the world, children everywhere began preparing their Christmas lists well in advance of any holiday-themed TV commercials or mall Santas sharing their jolliness. The news was bleak—you might not get your holiday gifts on time, if at all. Old Saint Nick’s excuse this year is easy—“It depends on the supply chain, Johnny.”
The pandemic’s effect on manufacturers varies by industry and region. But every supply chain leader has been pushed to alter their operations simply to maintain the flow of needed goods to consumers. As laid out with supporting data in e2open’s 2021 Forecasting and Inventory Benchmark Study, demand and supply fluctuations have led to transformational shifts in how business is done. Yet there are stellar examples of how to stay on course during a colossal disruption.
The accumulative effect of the ebb and flow of consumer demand, fluctuating labor restrictions caused by regional and national lockdowns and the need to clear the backlog of shipments during the ongoing Covid-19 pandemic has put the global economy on edge. The results are supply chain bottlenecks that have reduced the typical speed of shipments from offshore nations to the wealthiest and thriving global markets—far underscoring the “Amazon effect” as the new normal. It is harder to satisfy consumers’ expectations in this chaotic environment.
Because port congestion issues have been exposed to the general public, these challenges have borne most of the blame for the delays. However, e2open’s Ocean Shipping Index reveals a more complete picture. In the recently published report, we ascertain that other milestone activities contribute to the extended timelines. This new quarterly report tracks ocean shipment delivery times from when freight is booked to receipt of goods across major trade lanes between Asia, North America and Europe to help importers mitigate risk and make better decisions.
By analyzing aggregate, real-world data from e2open’s business network, which encompasses 26% of all global ocean bookings and gives visibility into more than 40% of international container trade, the e2open Ocean Shipping Index provides a data-driven reference for shippers to understand how long it takes to move goods internationally, as well as the factors that contribute to observed delays.
The report is valuable to shippers because it provides an accurate, historical understanding of how long it takes to ship freight, especially for just-in-time supply chains. Detailed understanding of the time required for containers to arrive at the port, clear customs, and be ready for pick up by ground carriers is the key to streamlining port operations and decongesting logistics operations. Among other things, this quarterly index provides a new level of visibility so that shippers can better understand when to book capacity for goods to arrive at the required date.
Bear with me as I draw an analogy to help communicate how to use the index to your advantage. If you’ve ever hit a patch of ice while driving, the first instinct is to put two hands on the wheel and grip tightly—gain better control of the vehicle. The same impulsive reaction was seen from supply chain leaders. But some issues need to be resolved first. If the windshield is covered in ice, you don’t know where to steer and avoid a collision, so gaining clear visibility is foremost. Then you need to know what you actually can control before trying. You can’t control the skid, but you can alter the vehicle’s direction by steering into the skid.
Similarly, you can’t control your shipment once it’s turned over to the carriers. You’re dependent on the port of loading, the weather conditions en route, congestion at the destination port, staffing and equipment availability, driver readiness and more. So how can you be in control? With the data from this report, companies can modify their upstream processes by executing bookings earlier than usual, knowing the average length of time in this scenario. Transportation volatility—driven by high demand, container shortages and port congestion—has made historical lead times unreliable, increasing the risks of disruption in downstream production and customer service. Equip yourself with great visibility and knowledge about what you can control to avoid any further disruptions.
The Ocean Shipping Index is available free of charge here. You can also register to receive future reports automatically.
