In January 2022, the world entered another year of living and working in the Covid-19 pandemic and the major changes that came with it. The collective machine of makers, movers, and sellers that keep global commerce going sought sage advice from analysts to brace for what might come next. As the single largest disruption in modern history, the pandemic was also the most extensive stress test of economies, businesses, and supply chains worldwide. It is important to note that the pandemic did not create new weaknesses. Rather it accentuated existing fractures within organizations, processes, and systems — often to the point of failure.
As stated in e2open’s 2021 Forecasting and Benchmarking Study, “Businesses became structurally harder to forecast. Every business decision and every win or loss starts with a prediction of what customers will buy. The quality of each decision starts with the quality of the forecast. Unfortunately, forecastability — how easy or hard business is to predict — reached an all-time low during the onset of the pandemic. In the New Normal, supply chain forecastability stabilized at 65%, a 7% drop from the pre-pandemic baseline. The good old days are gone. Today’s environment is inherently more difficult to forecast than it was a decade ago, or even a year ago.” So, we won’t find fault with predictions set forth 12 months ago and instead chalk it up to the inherent unforecastability of the “Next Normal”. With that in mind, what can logisticians bear in mind as we enter 2023?
Reflecting on Logistics in 2022
As 2021 closed a year of escalating costs, capacity constraints, and labor issues, Gartner analysts predicted that “elevated ocean rates and capacity issues will continue for most of the year.” They also expected shippers to encounter many inland challenges in the new year. Labor issues at US ports, and carrier contract rates at high points would trigger long-term shipper-carrier contracts. Real-time visibility would be an ongoing technology concern for all parties working hard to please customers.
But what was the story in 2022?
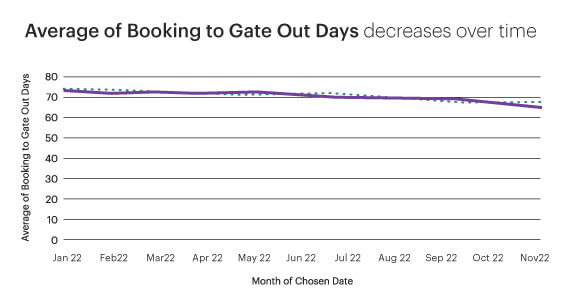
For ocean shipments, the time it took to deliver global shipments to truck or rail carriers after booking with an ocean carrier and completing the cross-ocean journey reached a high of 73 days in December 2021.

In the first five months of 2022, trip times remained near peak levels (72 days) but didn’t climb any higher. Since June, we have seen the time for cross-ocean journeys gradually decline to a rate of 65 days in November 2022.
Ocean freight rates started 2022 very high but decreased dramatically throughout the year, almost reaching pre-pandemic levels.
Labor issues continued to impact the ability to move goods in 2022. Lockdowns in China and labor strikes at ports in various regions kept the overall time to move goods high in the year’s first half. Still, consumer buying habits influenced by inflation and shifting to more spending on services versus ‘buying stuff’ is clearing up capacity constraints and helping clear port congestion.
Road freight in 2022 followed similar trends as ocean timelines. There was a shift from a carriers’ market, where capacity was scarce and rates were high, to a shippers’ market. Spot rates have dropped below contract rates and have yet to reach the bottom. Capacity has opened up, and carriers are offering lower rates to fill it. Transportation costs remain high, driven up by labor costs and fuel prices reaching a high in June 2022 ($5.75/gal). Fuel prices have declined but continue to be significantly higher than in 2021. With reduced demand for capacity, labor is now behind fuel prices in the list of concerns for carriers operating in an unpredictable market.
The Crystal Ball
Attempting to predict what 2023 will be like for supply chain logistics is like shooting at a moving target. We’ve realized that disruptions can come on quickly, with great impact, and possibly last long-term. E2open’s technology is supported by data from four rich ecosystems – channel, supply, trade and logistics partners provide valuable, real-time data for decision-making.
Working with our data scientists, e2open has already determined a new baseline for our shipping benchmark reports. Gartner states, “Logistics professionals frequently seek two very different types of benchmarking data. Transportation rate benchmarking compares transportation rates against the market, whereas logistics performance benchmarking compares logistics performance against other companies by using logistics-specific key performance indicators (KPIs) or metrics.”[i]
Decision-makers can access two free indices to more fully understand the impact of disruptions, gain unique visibility into supply chain movements worldwide, and take informed action based on actual data collected in e2open’s vast logistics network.
E2open’s freight benchmarking capabilities started in 2008 by BluJay Solutions and have grown with the acquisition by e2open. The e2open Road Freight Rate Index provides shippers and carriers with real-time visibility into freight costs and trends to enable smart decision-making based on active freight pricing data. Using data from e2open’s multitenant transportation network, the Road Freight Rate Index aggregates shipper and carrier market transactions for intermodal, dry van, and refrigerated shipments across North America. Contract rates and spot market prices are tracked, and the index serves as a basis for transportation procurement planning. E2open also provides the Road Freight Market Index, a monthly benchmark of transportation-specific KPIs derived from the over $18 billion in annualized freight under management transacting within the e2open Carrier Network.
E2open Ocean Shipping Index is published quarterly and analyzes data related to the trade lanes over 24 months. The data in this report concisely highlights key metrics such as the total time from initial booking to when a shipment exits the destination port. Summaries compare trends for the most recent quarter and year-over-year and show how they contrast with pre-pandemic averages.
When determining trend data for the Ocean Shipping Index recently, we realized our baseline was no longer accurate. To determine the stoplight color for each shipping lane, we compared the current quarterly value to the same quarter in 2019. However, this approach is no longer fitting because we cannot expect to return to pre-pandemic levels. Using this method, the trend data for the last four quarters for every evaluated lane was always red. Instead, using the data from a previous 24-month rolling period makes sense to evaluate trend data. Comparing the current quarter to the previous 24 months allows us to account for the dynamic nature of the current global landscape. This approach allows for the inclusion of new and ongoing events that can impact the trend without evaluating historical data that is no longer realistic.
Disruptions in the ocean and road transportation with vacillating capacity and price shifts have changed the strategies logistics leaders must leverage to mitigate the disruption, secure their global transport needs, and more effectively manage their costs. Cost optimization based on industry benchmarks is essential. E2open’s indices for road freight and ocean shipping are free. You can subscribe to them here. https://www.e2open.com/indices/
[i] Market Guide for Benchmarking Services for Transportation Rates and Logistics Performance Metrics, Published 13 October 2021, Brian Whitlock

Author
Nicole Hudson
As a Director of Product Marketing at e2open, Nicole is focused on Transportation and Logistics applications. Over her 20+ year career, she has held various positions in product management and product development for supply chain and logistics companies, including JDA and BluJay Solutions. She joined the product marketing team at e2open in 2022 with the BluJay acquisition. Nicole currently lives in WI and enjoys attending her kids’ volleyball and basketball games and traveling in her spare time.


